Technical Analysis Basics
Technical analysis organizes price history through charts, trends, zones and indicators. The guide remains educational and provides no signals.
Chart Types
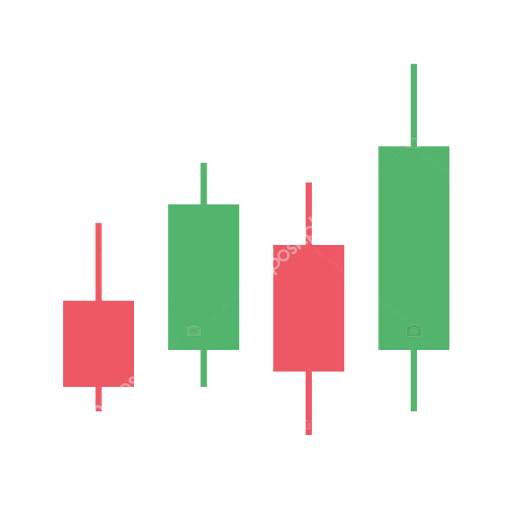
Line, bar and candlestick charts show price movement with different levels of detail.
Trends
Uptrends, downtrends and ranges describe the basic direction of a market.
Support and Resistance
Zones mark areas where market participants reacted strongly before.
Indicators
Indicators summarize price data, but they do not replace risk review.
Limits of Analysis
Technical analysis works with probabilities and can produce false signals.
Content is educational and does not replace financial advice. Examples are neutral and contain no trade recommendation. Risk Disclosure
Today in markets
Daily reference values from central-bank data, not tradable broker quotes.
Sources, method and limits
Calculators use transparent assumptions. Market modules use public reference data and external widgets. Content is educational market context, not investment advice.
Frequently asked questions
Is this investment advice?
No. Trading Spotter provides calculators, education and market context. Content is not personal investment advice and not a trade recommendation.
Is it free to use?
Calculators, market overviews and core education are public. Future offers or partner links are clearly marked.
Where does market data come from?
Market modules use public reference data, crypto spot data and external widgets. Sources and limits are stated transparently.
Save or share this page
This page can be saved as a working reference or shared with other traders.
Daily forex and crypto market outlook
Every morning: key pairs, crypto moves, market drivers and scenarios in one compact briefing.
AI-assisted market commentary. Content is educational market context only, not investment advice and not a trade recommendation.